
The DCF Model: What It Actually Tells You
Every analyst uses discounted cash flow. Most get it wrong. Here is what drives the number.

The Discounted Cash Flow model is the theoretical foundation of all valuation. Every other method — P/E, EV/EBITDA, revenue multiples — is just a shortcut for what DCF tries to compute directly: the present value of all future cash a business will generate.
The core idea
A dollar tomorrow is worth less than a dollar today. DCF discounts future cash flows back to today using a rate that reflects the risk of receiving them.
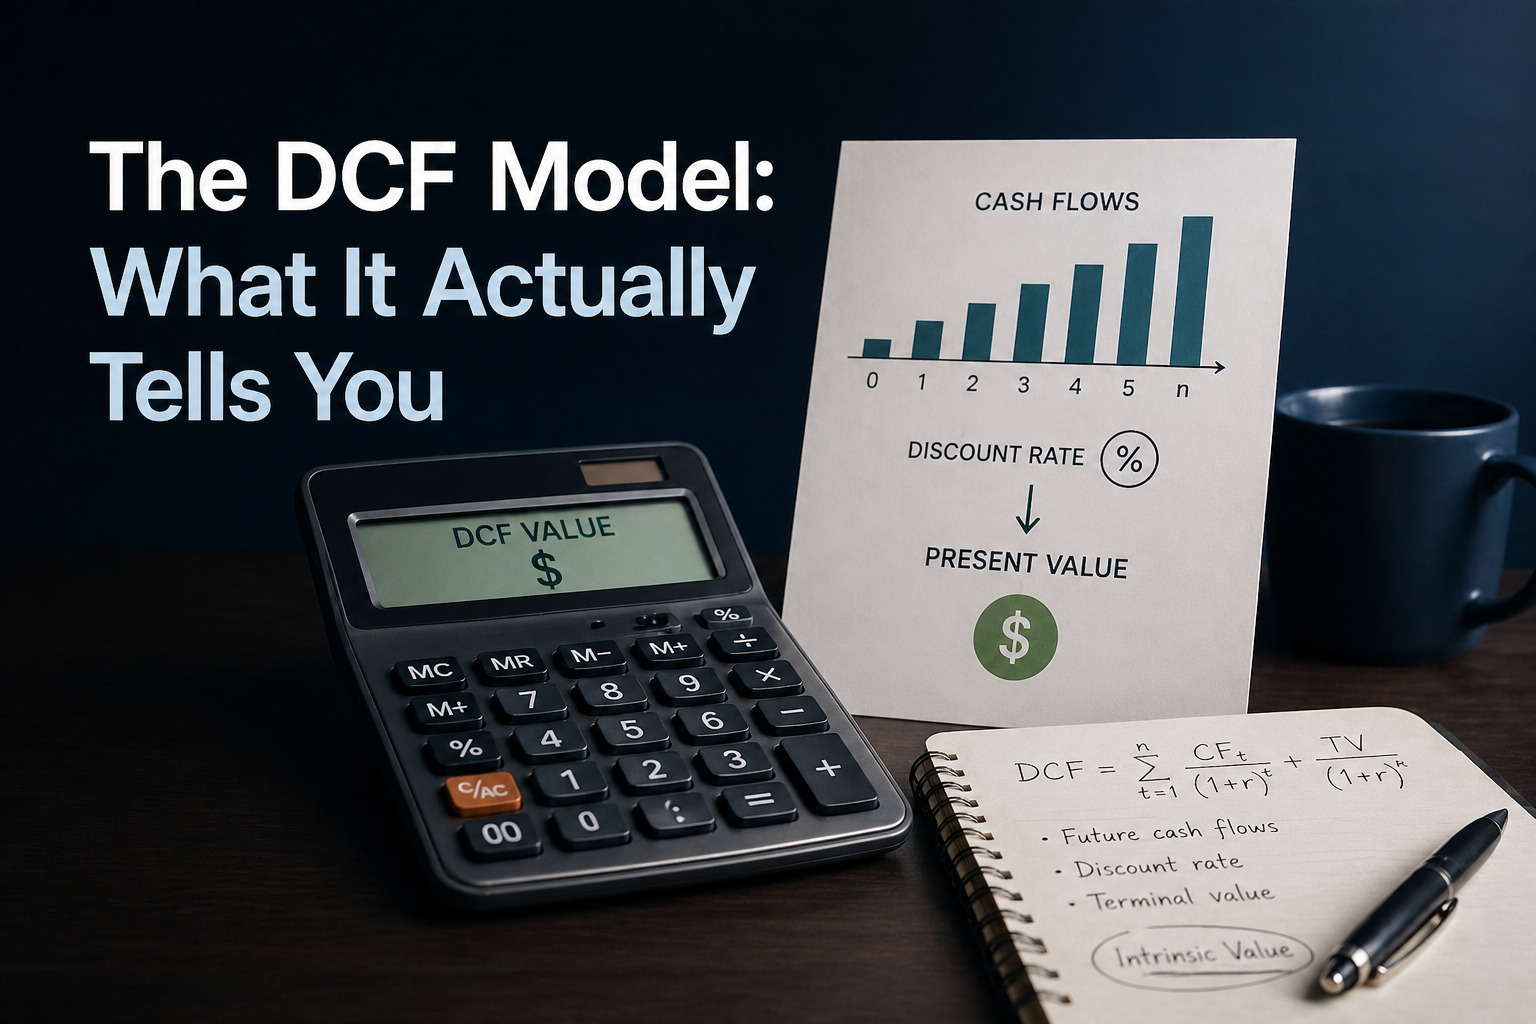
Value = Σ (FCF₀ / (1 + WACC)ᵗ) + Terminal Value / (1 + WACC)ⁿ
The three inputs that drive everything
- Free Cash Flow growth rate — The most impactful assumption. A 2% change can swing DCF value by 30%+.
- WACC (Weighted Average Cost of Capital) — Typically 8–12%. Lower WACC = higher valuation.
- Terminal value — What the company is worth after your forecast period. Often 60–80% of total DCF value — the model's biggest weakness.
Why most DCFs are garbage
- Revenue growth too optimistic — Analysts anchor to management guidance
- Margins that never compress — Competition and mean reversion are real
- Terminal growth above GDP — No company grows faster than the economy forever (use 2–3%)
- WACC too low — Using 7% for a volatile small-cap is wishful thinking
When DCF works vs. fails
Works: Mature, cash-generative businesses with predictable revenues (utilities, consumer staples, SaaS).
Fails: Early-stage companies with no FCF, cyclicals (semiconductors, oil), turnarounds.
The sensitivity table
The most valuable part of any DCF is the sensitivity grid: what happens to implied price when you vary WACC and growth rate? If the stock is cheap across most of the grid, that's a real signal. A single DCF number is false precision.